Power BI Introduction
First time I can in contact with Microsoft Power BI was in context of an analysis and since then I really love to work with it. Power BI is a Business Intelligence solution that is more or less for little or medium-sized companies, not least because of it’s pricing, if you don’t use it in the cloud it is for free and mostly also in the cloud for free. But Power BI also works not only as a competitor of big (Data Warehouse) solutions, it also works fine with Tableau for example as Avichal Singh describes in this post.
If this is your first attempt with Power BI you probably want to have a look at youtube first. There you also will find videos about Power BI and the Soccer World Cups (1930 – 2014), created by Microsoft, provided with a link to powerbi.com where you could look up the examples. Unfortunately, the link doesn’t work any more.
Anyway, after watching the videos you are probably “hungry” for doing your first analysis in Powre BI! Here you will find a great post, also by MS, how you can do a really interesting comparison on how obesity may be connected with the per capita income in all of the countries around the world. And all data is in the cloud, for free!
But maybe you are more interested in some soccer, so let’s get started!
Getting started
Of course, Germany is one of the countries with a high enthusiasm for soccer, not only since we won the World Cup in 2014! And because of this, there are a lot of sources where you can get data to work with. Some examples:
- wikipedia
- weltfussball.de
- fifa.com
- fussballdaten.de
- kicker.de
There are probably more and if you maybe have a better source than the ones I am using I would love to here about it.
In this post I use wikipedia as my source because:
- all data is in english language so that also users, who don’t speak german can work with this example
- later in another post I would love to connect this analysis with data from fifa.com, and this data is only in english
- if we want to expand our example with other World Cups it will be helpful to use also data from wikipedia and fifa.com
This post is in english and so is the installation of my Power BI Desktop. You don’t need to download it, you can also use Excel (Professional Plus!!) and download and activate all necessary Add-Ins (PowerQuery, PowerPivot, PowerView and PowerMap).
Analysing Soccer World Cup 2014
Open the Power BI Desktop and get new data from the web:
Enter this link:
https://en.wikipedia.org/wiki/List_of_2014_FIFA_World_Cup_matches
Select the first table and click “Edit”:
Since I don’t care for Day and Time, I just remove these columns by marking them, right-click, Remove Columns:
I also don’t care about “Match” or “Column 9”:
Let’s rename some columns: “Venue”…
…to Stadium:
“Team 1” …
to just “Team”:
and “Team 2” to “Opponent”. For a more convenient design let’s move the column “Result” to the right.
But we still have some rows in our data that we don’t want or don’t need for our purpose, like the first to lines for example. Ascending sorting the column “Result” will put all games on top since all rows start with a number. So now we can just delete the lines on the bottom:
Of course, not the professional way to get rid of the data, but this is also thanks to wikipedia, weltfussball.de doesn’t have these issues, but also doesn’t have a connection to the stadiums. C’est la vie…
Later I want to see all games in the order the games where played, but without using the date. So we have to do some renaming. Rename the column “Stage” like this:
- Group A –> (1) Group A
- Group B –> (1) Group B
- Group C –> (1) Group C
- Group D –> (1) Group D
- Group E –> (1) Group E
- Group F –> (1) Group F
- Group G –> (1) Group G
- Group H –> (1) Group H
- Round of 16 –> (2) Round of 16
- Quarter-finals –> (3) Quarter-finals
- Semi-finals –> (4) Semi-finals
- Third place match –> (5) Third place match
- Final –> (6) Final
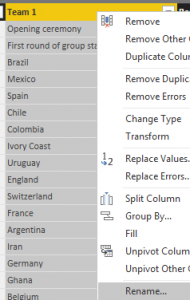
To do so: Right-click on “Replace values”:
Enter the values above:
We also want to know how often a game was won, lost or a draw. We can to that with help from the column “Result”:
You can see that sometimes, there is not only the result but also some information if it was won after extra time oder penalty.
We need to get rid of it or better store it in another cell, maybe you want to use it later!?
Duplicate the column “Result”:
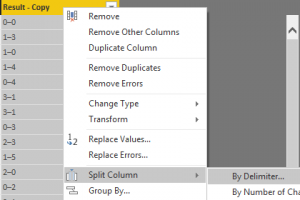
Split the new column “Result – Copy”…
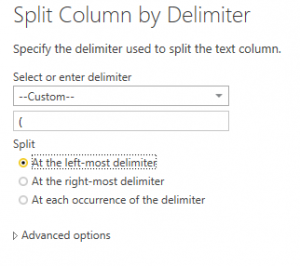
…with the delimiter “(“:
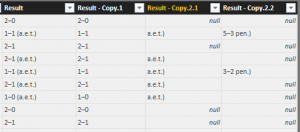
Now we have three columns:
You need to split the last column again by the delimiter “(“:
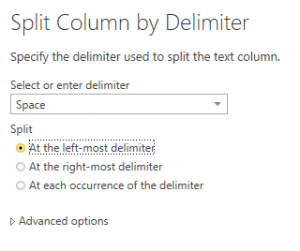
And again, split the new column “Result – Copy.2.2 by delimiter, but this time by space:
See all columns after renaming:
Get rid of the “)” in the columns “Result – Copy.2.1″ and Result – Copy.2.2.2” by replacing the value with nothing. Also use the TRIM-Funktion on these columns.
Let’s add a new column “Endresult”:
And another column “a.e.t./pen.”:
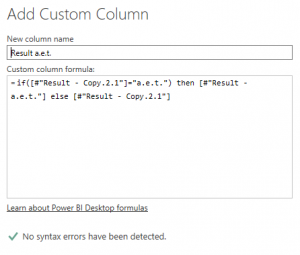
Last one: “Result a.e.t.”:
Enough with all these nonsense, delete the following columns:
- Result
- Result – a.e.t.
- Result – Copy.2.1
- Result – pen.
- Result – Copy.2.2.2
This looks much better. But we still are not done here!
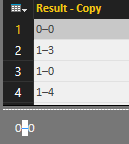
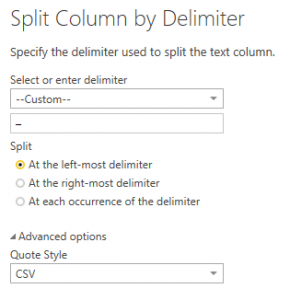
We need to split the result. To do so, duplicate “Endresult” and split it. Actually, we could split it by the number of characters, since there was no game at the World Cup 2014 that was double-digit (although Germany – Brasil was the closest I have ever seen at a World Cup). But since it is theoretically possible let’s do it by the hyphen (-). The hyphen used on wikipedia is not the one on your keyboard, so better click on a result and copy it (also paste it in OneNote or another tool, we’ll need it again later).
Split the column:
So that it looks like this:
Rename it:
And be sure that both columns are “Whole Numbers”:
We will add a new column “Win” (Add-Column –> General –> Add Custom Column) with the formula down in the picture:
Do so for 2 other columns “Draw” and “Loss”, but with different operator (< and =). All columns have to be “Whole Number”-Types!
Nice work.
Give the query a useful name:
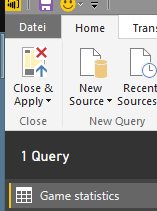
Apply and Close:
Loading:
Finally, we can create a clustered column chart in the report area on the left side:
Add another table:
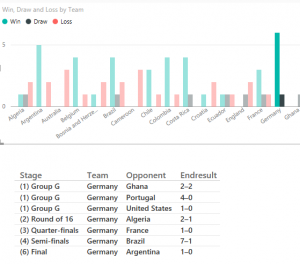
So now if you select a Team you can see all the games this team played during the World Cup:
But wait: These are only half of the games? This is because we only reference the field “Team”, so that all the games the team was placed as second team (“Opponent”) are not listed.
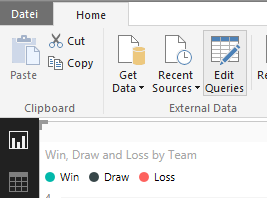
How to solve that? Go back and edit queries:
Unfortunately, we need to do everything we did to get here again. STOP, before you freak out because you don’t want to do it all over again: We only need to do all the steps again, only SOME of it!
The query “Game statistics” is open again, click “View –> Show –> Advanced Editor”. Select and copy everything (Strg+A and Strg+C).
Close with Cancel.
Open “Home –> New Query –> Recent Sources” and click on the top source, this should still be our wikipedia-source. Open it like before, open the editor again and replace the code with the code you copied above:
Do not confim with “Done”, not yet. Look for the line we renamed Team and Opponent:
Chage it as follows:
“Done”.
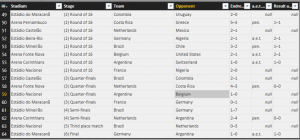
Since team and opponent are inverted, Argentina won the World Cup:
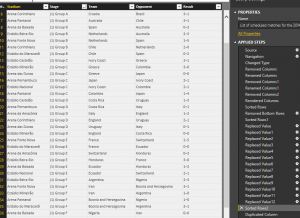
Better change that real quick. On the right side under “Applied Steps” click on the step “Sorted Rows2”. This is where we finished renaming all those entries in the column “Stage”:
You could see the “Applied Steps” on the right side as a timeline of all actions you do and you can interact with this timeline.
So after you hit the “Sorted Row2” split the column “Result” again using the hyphen (the one you copied away in OneNote or wherever). You get a warning:
This warning will appear everytime you interact with the “timeline”, just click “Insert”. Power BI Desktop simply wants to warn you that the actions after this new step might not work. This is the case since we deleted “Result”-column and all actions are built up on it. So if you would click the next action, you’d receive an error:
But we’ll fix that in a minute.
“Result” is splittet in “Result.1” and “Result.2”. You need to split “Result.2” again, using a space:
It should look like this:
And now we concatenate the columns in the correct order “Add Column –> General –> Add Custom Column”:
Important: The name of the new column is “Result” and the delimiter we used in the formula for the new column is the one we used above to split the column!
Delete all the other columns we don’t need any more so that Germany again is the winner of the World Cup!
That’s better 😉
We are still in the middle of our “timeline”, so just click at the end of it on the last step
Give it a Name:
Back to our query “Game statistics”, and click “Home –> Combine –> Append Queries”:
Yeah, Game statistics now has 128 entries instead of 64!
Close& Apply
The visualisation looks much better:
Will be continued with more visualisations!


















Leave a Reply
You must be logged in to post a comment.