I already posted about gantt diagrams in excel but this time i like to post about gantt diagram in sharepoint. Gantt diagrams are useful for project and tasks and for the managing of those. So i expected to get a good overview of my tasks or projects by using this sharepoint features.
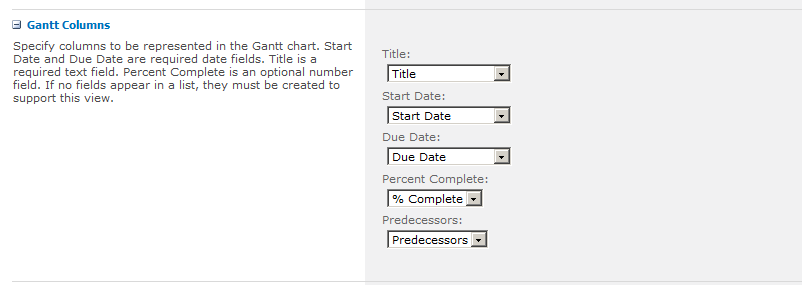
It is not really a feature, it’s a view which can be used. This view needs some special columns:
- Start Date from type Datetime
- Due Date from type Datetime
- Percentage from type number
- Predecessors

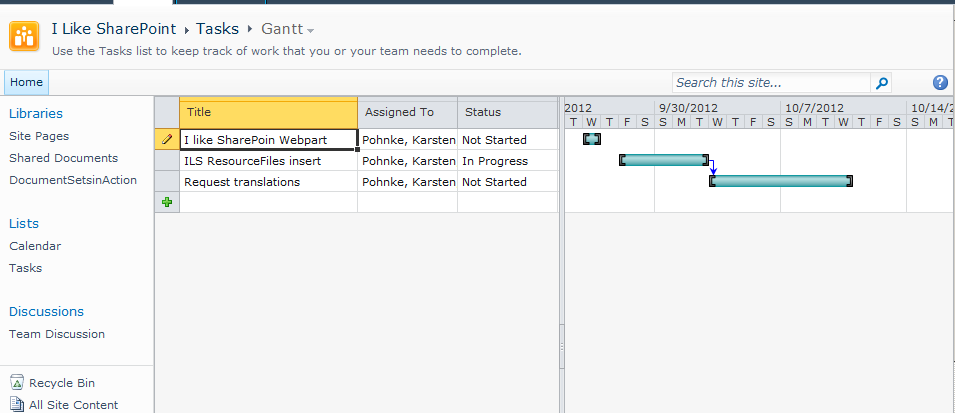
So it’s really simple to get a gantt diagramm. I used a tasklist. Put some values into and create a new view from type gantt view. I set the 5 columns as desired and saved the view. Now the result is a gantt view:

Really nice, you can see also the dependency between tasks and the planning dates (start and due). But what i would like to have is a bigger overview. What if your tasks takes much longer? If tasks taking one or two month? In this screenshot you see the daily base. On the horizontal top bar, the dates for each day is displayed. That’s not really great for an overview over some month.
The trick – well it is not a trick, but you have to know it. Just click in the ribbon bar on the zoom out as much as you like and you get this nice overview:

This is exactly the view i wanted to see. So you are able to use standard features for project management, with dashboards and gantt views and there is no need for code. The only thing which should be possible: I cannot save the zoom factor. Each time i open the view i have to zoom out for this view.
Hope this helps.
..:: I LIKE SHAREPOINT ::..